Scanning FAQs
Click on the +buttons to open the collapsible content.
Purdue University 3D X-Ray Microscope Facility Recharge Rates |
|
|---|---|
Internal (Purdue University Researchers) |
|
| Scan provided (per scan hour) | $33.00 |
| Exploratory Analysis (per set-up hour) | $40.00 |
| Training or Analysis (per hour) | $41.00 |
| Self-Scan (per scan hour) | $30.00 |
External (Academic and Non-Academic) |
|
| Exploratory Analysis (per set-up hour) | $62.00 |
| Scan Provided (per scan hour) | $51.00 |
| Analysis (per hour) | $40.00 |
Currently no. We have yet to come across a sample we refuse to scan. That being said low Z materials, especially organic materials can present a challenge when trying to optimize scan parameters to minimize scan time without leveraging too much of the resolution and data quality.
Special approval from Dr. Laura Pyrak-Nolte will also be needed to image samples and/sample setups that involve fluids.
Hands-On Training
Hands-On Training comprises of Scout + Scan Training and exposure to the following techniques: AutoStitching, Manual Referencing, Scout + Scan + Zoom, Reconstruction, Overview of TXM3DViewer, and a brief introduction to DragonFly.
Shadow Training
Involves the user setting up a tomographic recipe point in Scout and Scanvwith supervision. During this time a Super User will be present to answer any questions and advise the user.
All New Users are required to complete two Hands-on training and two Shadow training sessions.
XCT scans that yield high-quality data can vary from material to material and even from sample to sample of the same material depending on the sample dimensions, shape, and microstructure. For the Zeiss Xradia 510 Versa System scans can range from 15 minutes to 48 hours long or more.
The length of scan time can depend on the size of your sample, density, dimensions (height, length, width), material characteristics, desired resolution, desired FOV, and desired data quality. Scan times can be altered, but do keep in mind that minimizing scan times from the most optimal parameters may not yield the best data quality for your research purposes.
A dense or thick object that has low X-Ray transmission will incur longer scan times. High-resolution scans or imaging small samples and/fibers may have longer scan times if parameters are selected that will provide the desired resolution while minimizing noise. In any case, the best step forward is to figure out what parameters will work best and what the resulting scan times may be for your particular sample and research needs. Connect with us to start an Exploratory Analysis which will allow us to provide you with several scanning options.
Auto-Reconstruction of 3D imaging volumes generally assumes that the beam attenuation is linear. However, for X-ray systems that utilize a polychromatic beam with a range of energy spectrum that is not uniformly attenuated when passing through an object, an artifact can be produced called beam hardening.
This occurs in situations where the lower energy component of the X-Ray spectrum is more easily attenuated and/ sometimes absorbed when traversing through a dense part. When the volume is reconstructed from the projections, the 3D volume will have brighter voxels along the edge of the object. This can occur even in cases where the sample itself is composed of homogeneous material.
Scout-and-Scan Control System can also be used for 2D-image viewing for:
ZEISS-specific images (*.xrm files which contain only one image.) or *.tiff or *.png file formats
Tomography recipe files:
*.rcp
Datasets that contain a collection of projection images are saved as:
*.txrm files.
Each *.txrm file contains multiple images.
Slices generated from each *.txrm file are stored in a:
*.txm file.
if Out-of-core mode is selected when using XM3DViewer, two large files are created:
*.txm-exm and *.txm-exm-ooc
These files should be deleted after generating reports
We can output data into most file formats. Please indicate what image file type you wish to receive:
*.png, *.tif, *.tiff, *.dicom, *.raw, *.jpg, *.czi, etc.
If no specific region is selected during reconstruction, the number of slices is equal to the height of each projection image in the original
A *.txm file contains a collection of 2D slices that make up the 3D reconstructed volume.
All Data should be saved on the 3D XRM Workstations :D Drive
All Data should be retrieved from the :D Drive on the Image Analysis Workstation.
The /:D/Data Share is generally purged annually so please always collect your data after scanning
Full Field of View refers to a data set where the whole sample can be observed with the air around the sample.
Field of View also refers to the area observed in the imaging window when setting up a tomographic recipe
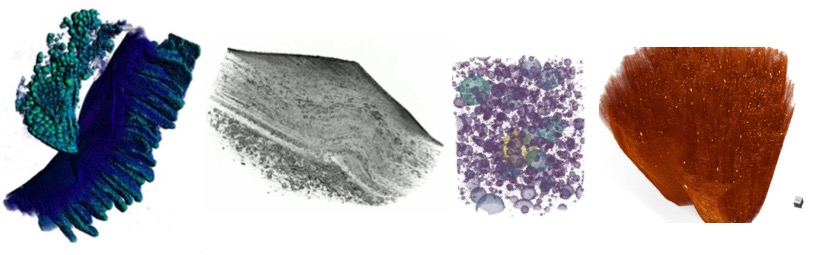
We have scanned a wide variety and materials here are the 3D XRM Facility.
For very thin, lightweight, low-density or low Z (low atomic number) materials such as organic materials, we recommend scanning at a high number of projections and good intensities to acquire good data.
Applying a dense/thick material pack around the sample can help improve contrast by lowering X-Ray transmission/ absorption across the sample. In our experience for such samples, we recommend scanning at FOV < 6mm. If you wish to have 1-2 μm resolution then smaller FOVs (roughly 1000*high-resolution) will work best to yield high-quality data.
With all data, we can provide *.tiff stacks or any other image type stack you need. Please let us know what data format you prefer. We also provide for Scan Provided clients, images of the scan data in 2D and 3D views in a project report presentation which would contain images and animations, and possibly some data analysis upon request such as porosity, thickness maps etc. For Self Scan users, you can output your data into any format needed.
Also located at our facility is an Image Analysis workstation that can be reserved by an internal researcher wishing to work at the facility with their data.
Data Analysis Services we offer:
- Feature extraction
- size, 3D morphology, aspect ratios, etc.
- Data Filtering
- Change detection
- based on intensity mapping
- 2D and 3D visualization
- We provide 2D stacks and 3D animated videos of different cuts through the samples
- Mosaicking
- Image conversion to different digitized format
- Image compression
- Advanced image processing and data analysis with machine learning
A few Image Analysis Resources
Non-Commercial DragonFLY License (Educational Copy)
FIJI (ImageJ) Image Processing Software
MicroView 3D Image Viewer & Analysis
Image Analysis notes - Cornell Institute of Biotechnology
Halide - A language for fast portable computation on images and tensors
ProxImal - Python embedded modeling language for image optimization problems
Create easy portable videos with - Handbrake
Handbrake - Freeware for converting to video format
Python script for moving and deleting files in bulk
Codes and plugins for removing stationary noise located here
OrientationJ a series of imageJ plugins to perform directional image analysis
MonogenicJ - a wavelet based software to perform multiresolution monogenic analysis of 2D images
SciKit - Image processing with Python
Quantitative Imaging group at Cambridge
Mathematics and Physics of Emerging Biomedical Imaging: X-Ray Computed Tomography