Demos: 1C-06 Constant Acceleration Graphs——Motion Encoder
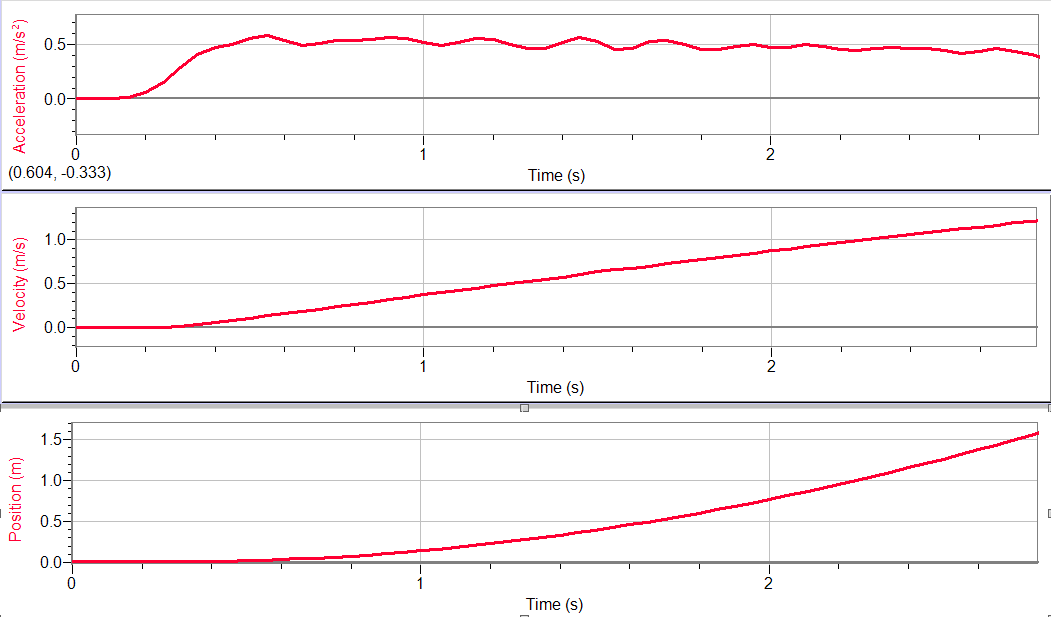
A fan cart on a smooth horizontal track with a striped decal attached to the track is allowed to move between bumpers. Its position is recorded as a function of time using an optical sensor under the cart which senses movement over the striped decal. The computer displays the corresponding distance versus time, velocity versus time and acceleration versus time graphs. The advantage of using the encoder system is the smoothness of the graphs and no interference from stray objects near the track as opposed to using a motion detector.
Directions: Before attempting this demonstration, you should consult with the lecture-demo technician on how to set up the software for measurement. When the computer is in the measurement mode, engage the fan on the cart and record its motion for about 5 s.
Suggestions for Presentation: Although students will likely predict accurately what the acceleration versus time graph will look like for uniform acceleration, ask what the distance versus time and velocity versus time graphs will look like.
Please Note: As an alternative to using the fan cart, you can use a block to raise one end of the track. Start the demonstration by placing the cart at the raised end and letting it move towards the motion encoder. Or push the cart up the track and let it return to the starting position. Before doing this, ask your students to make a prediction about the shape of the three graphs.
Applications: None