Demos: 1C-03 Distance Graph Match—Motion Detector
A graph of distance vs time is displayed on the computer screen. The demonstrator (lecturer or student volunteer—preferably the latter) moves his/her own body or a cardboard sheet back in forth in front of a motion detector in an attempt to duplicate the graph on the screen.
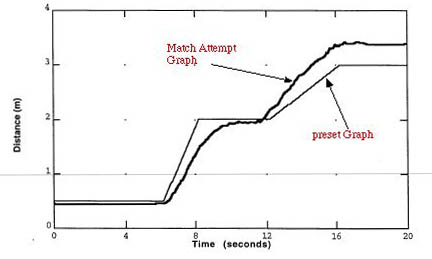
Directions: You should consult with the lecture-demo technician for the proper settings on the computer. When the graph is displayed (several different shapes are available), move the object in front of the detector in such a way that you duplicate as closely as possible the displayed graph. [See example below.]
Suggestions for Presentation: Present on the computer screen a graph of distance vs time, preferably one that is fairly simple. Ask what kind of straight line motion would produce such a graph. Have a student attempt to duplicate the motion. (More than one try can be made. The previous data are erased.) Then graduate to more complicated graphs. This exercise is very instructive, especially to the one who’s doing it. Many of the moves required to duplicate the graph are counterintuitive.
Applications: None
Last Updated: Nov 30, 2023 11:25 AM