Demos: 1C-02 Graphs of Motion of a Cart on a Track—Motion Encoder
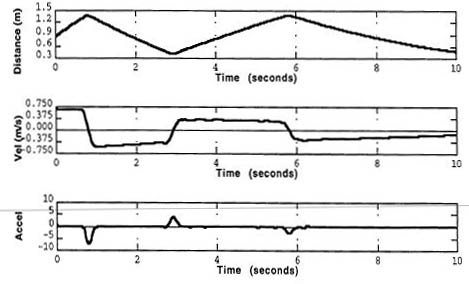
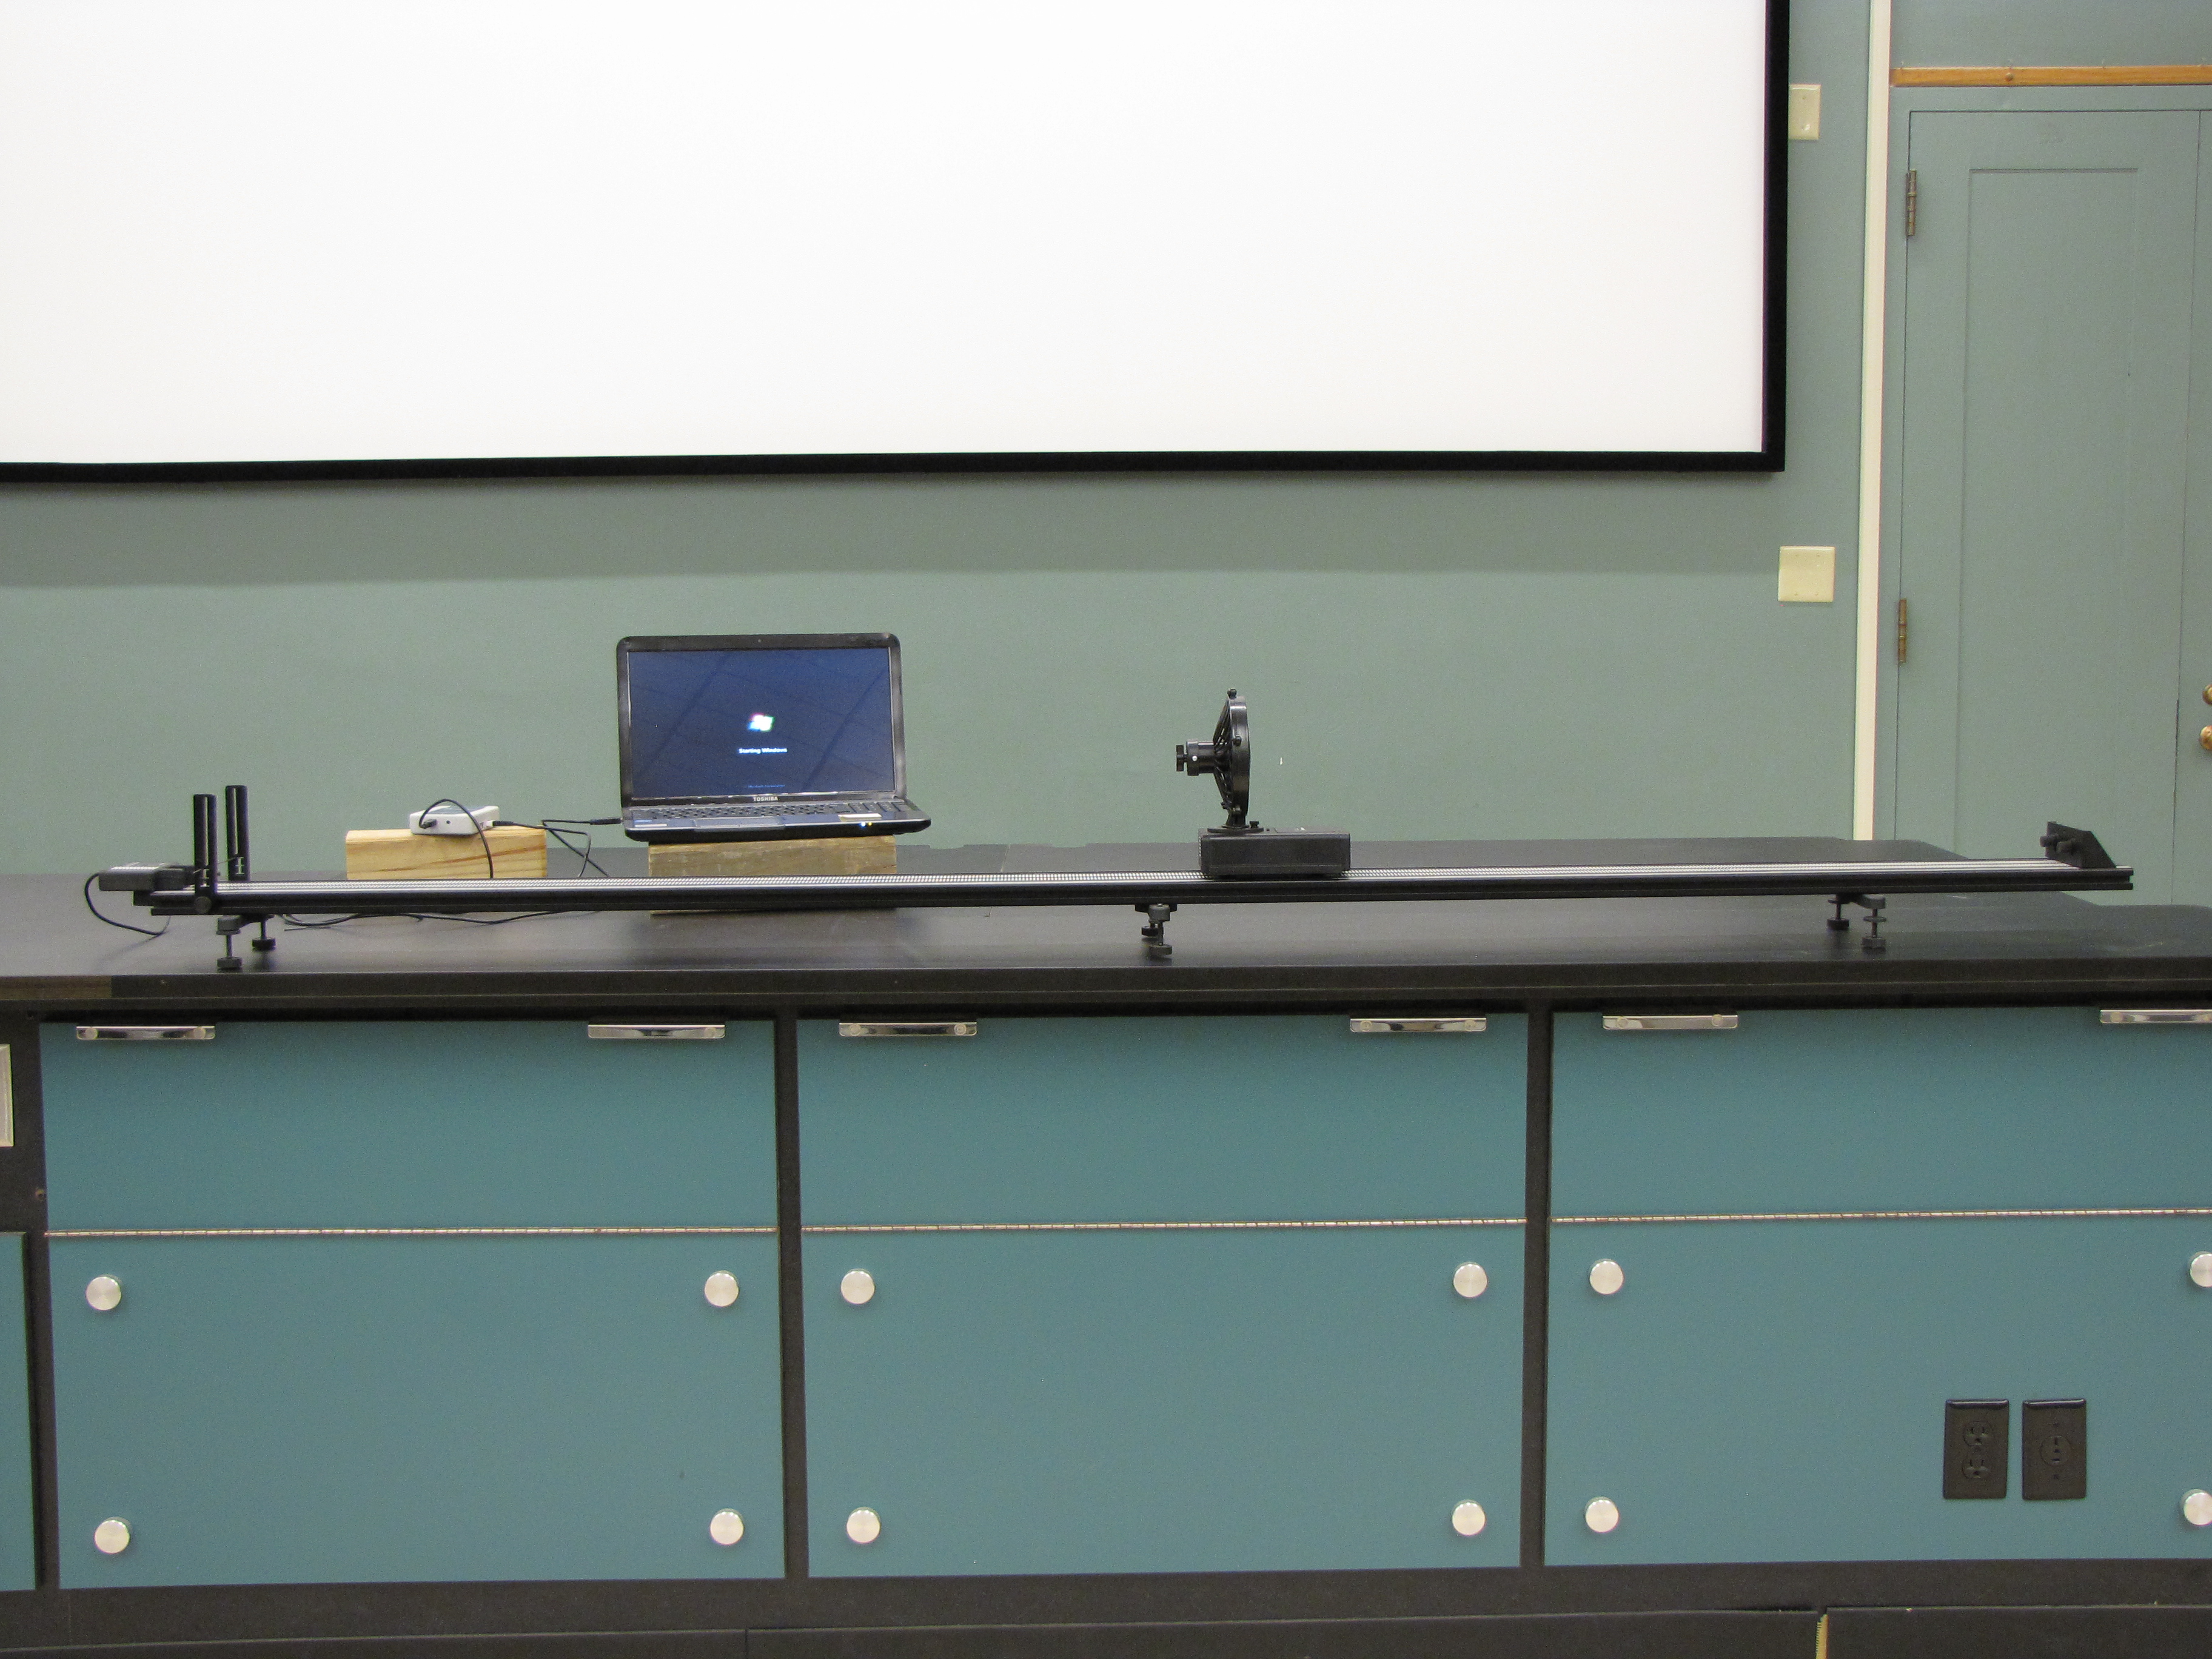
A cart on a smooth horizontal track with a striped decal attached to the track is allowed to move back forth between bumpers. Its position is recorded as a function of time using an optical sensor under the cart which senses movement over the striped decal. The computer displays the corresponding distance versus time, velocity versus time and acceleration versus time graphs. The advantage of using the encoder system is the smoothness of the graphs and no interference from stray objects near the track as opposed to using a motion detector.
Directions: Before attempting this demonstration, you should consult with the lecture-demo technician on how to set up the software for measurement. When the computer is in the measurement mode, push the cart gently and record its motion for about 5 s. Friction will be evident in the motion shortly after the push, so if you wish to avoid this effect stop the recording early. [See sample graph above.] If you wish to demonstrate frictional effects, record for a longer amount of time.
Suggestions for Presentation: Although students will likely predict accurately what the velocity versus time graph will look like for uniform velocity, ask what the distance versus time and acceleration versus time graphs will look like, both in the constant speed portion and when the cart changes direction.
Applications: None