| Figure 1. |
| Theoretical arrival times of photons at an altitude of 1300 m from point sources at various altitudesstarting at 1500 m and stepping by 1000 m. The colors also indicate the altitude of emission. Purple: photons emitted above 10,000 m. Blue: photons emitted between 6000 m and 10,000 m. Black: photons emitted below 6000 m. | 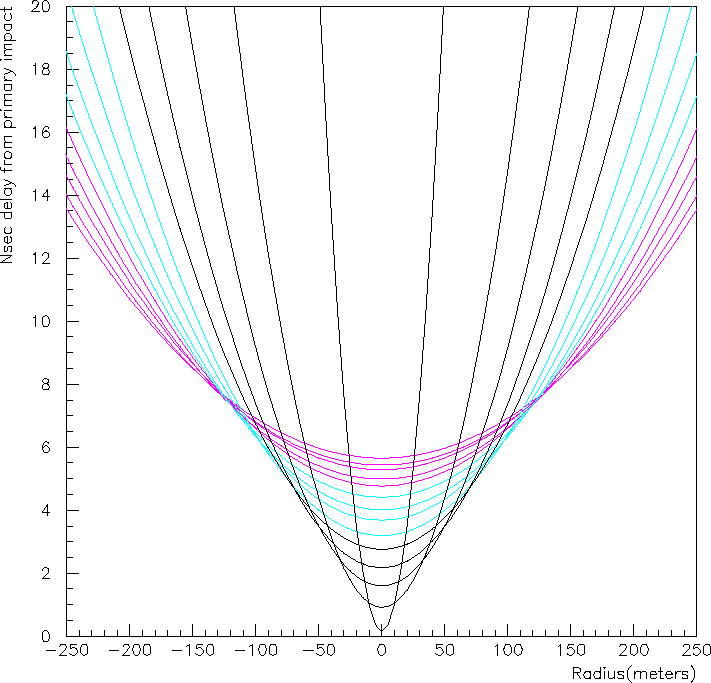 |
| Figure 2. |
| Arrival times of photons at an altitude of 1300 m from a track of point sources inclined at 30 deg atvarious altitudes starting at 1500 m. The colors indicate the altitude of emission of the photons asdescribed in Figure 1. | 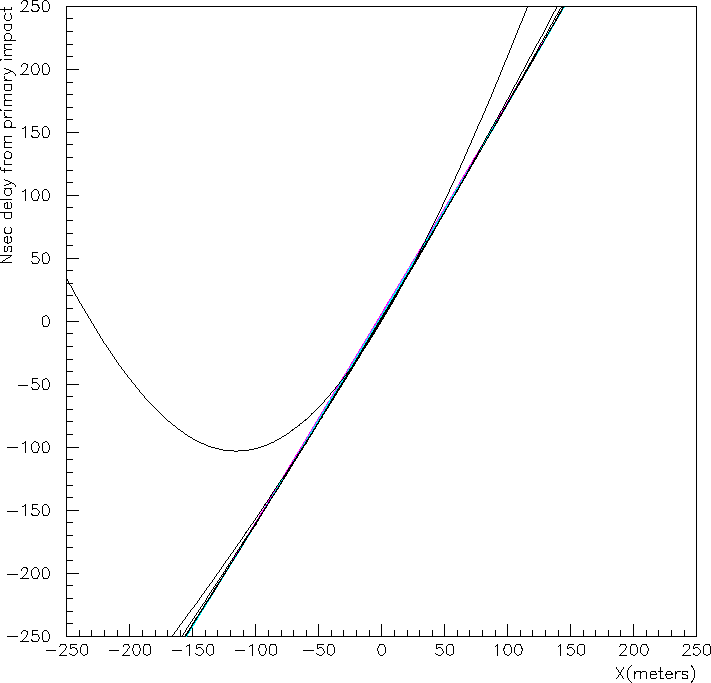 |
| Figure 3. |
| Arrival times of photons at an altitude of 1300 m from a track of point sources inclined at 30 deg atvarious altitudes starting at 1500 m. Timing corrections due to inclination have been made. Thecolors indicate the altitude of emission of the photons as described in Figure 1. | 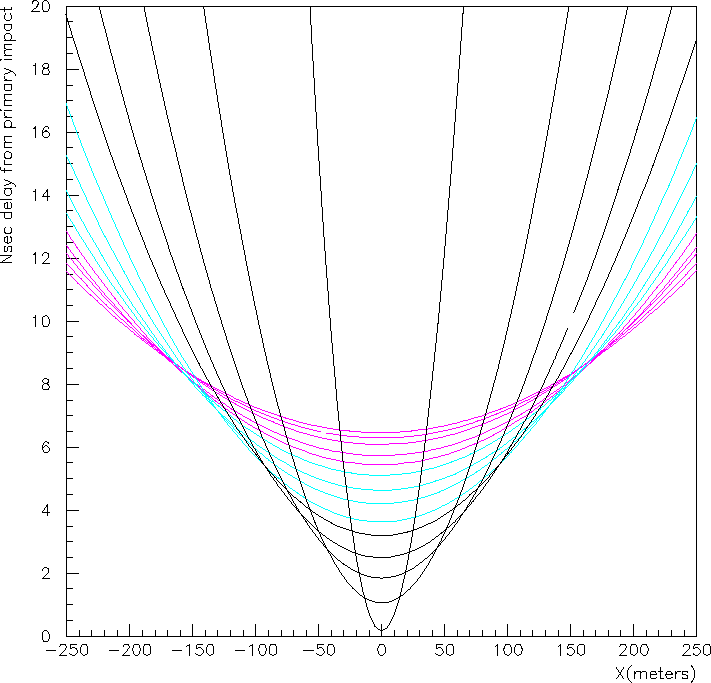 |
| Figure 4. |
| Arrival times of photons at an altitude of 1300 m from a track of point sources inclined at 30 degperpendicular to the Y axis. Lines are from various altitudes starting at 1500 m. The colorsindicate the altitude of emission of the photons as described in Figure 1. | 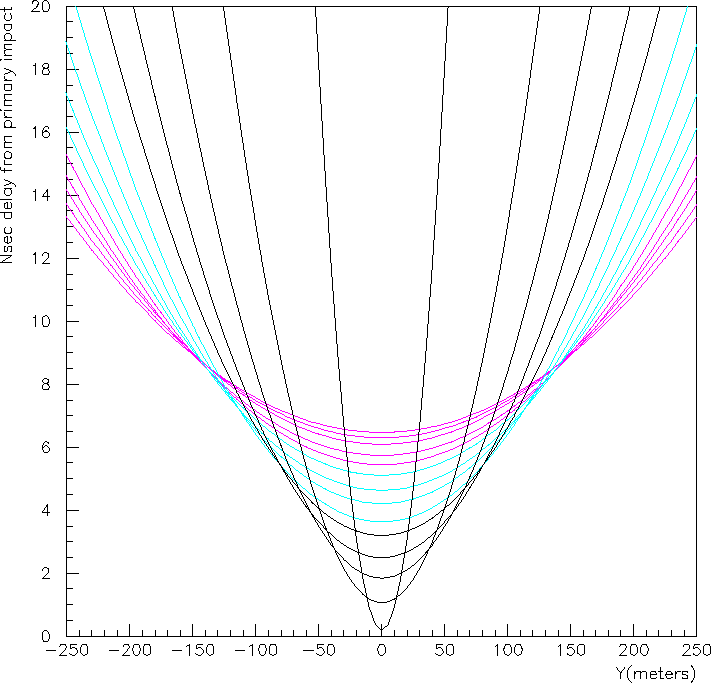 |
| Figure 5. |
| Monte-Carlo generated arrival times of the Cherenkov photons as a function of distance for theshower core for a 50 GeV gamma ray initiated atmospheric cascade. The time is relative to thearrival time of the incident particle if it had continued at speed c. The colors indicate the altitude ofemission of the photons as described in Figure 1. | 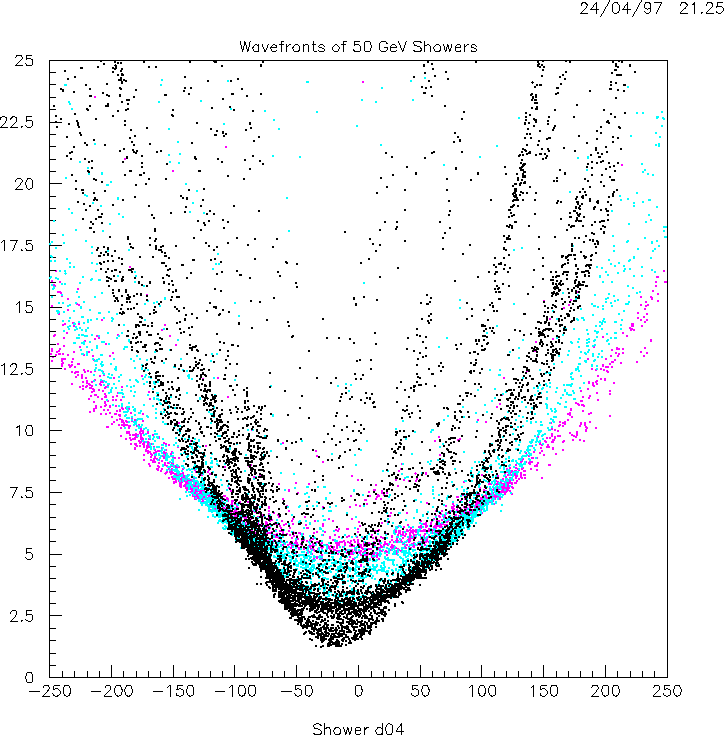 |
| Figures 6.a to 6.h |
| Each panel shows a series of different plots for one Monte-Carlo generate gamma ray shower. Thepanel on the left shows the particle tracks of the atmospheric cascade. Tracks in green representelectrons, tracks in red represent positrons.
The right panel shows four different plots for the same shower. Upper Left: Cherenkovphoton arrival times as a function of distance from shower core. This is the time the photon impactsrelative to the arrival time of the primary particle if it had continued at speed c. The colors indicatethe altitude of emission of the photons as described in Figure 1. Upper Right: Arrival timesfor those photons hitting in a 15 m x 13 m area centered on the shower core. Lower Left:Emission altitudes of these same photons. Lower Right: This is a scatter plot of arrivaltimes vs. emission altitude.
There are two showers shown for each energy. 6.a and 6.b are for a primary gamma ray energy of20 GeV. 6.c and 6.d are for 50 GeV. 6.e and 6.f are for 100 GeV. 6.g and 6.h are for 300 GeV. | 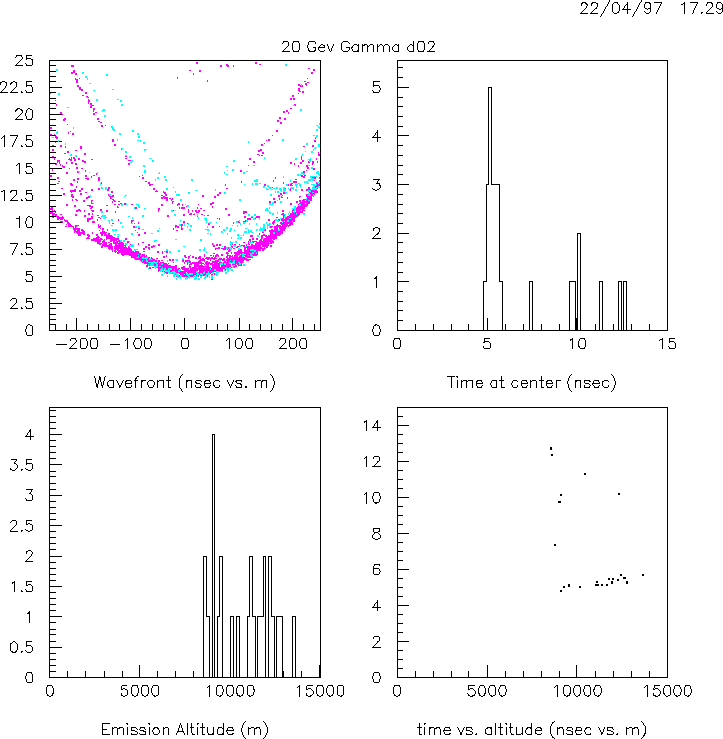 |
| Figures 7.a to 7.d |
| This series of plots shows the arrival times of the Cherenkov photons as a function of distance fromthe shower core for Monte-Carlo generated atmospheric cascades. These plots were chosen to showthe variation in timing wavefronts due to fluctuation in shower development. 7.a is for 20 GeV, 7.b for 50 GeV, 7.cfor 100 GeV, and 7.d for 300 GeV. The color indicate the altitude ofemission of the photons as described in Figure 1. | 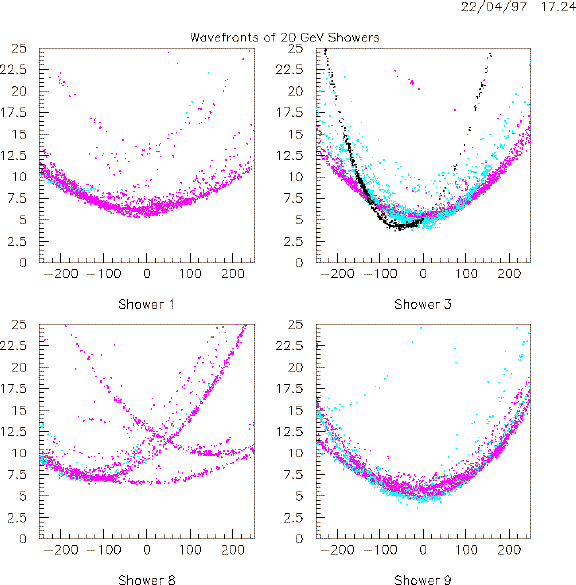 |