Figure 7.a
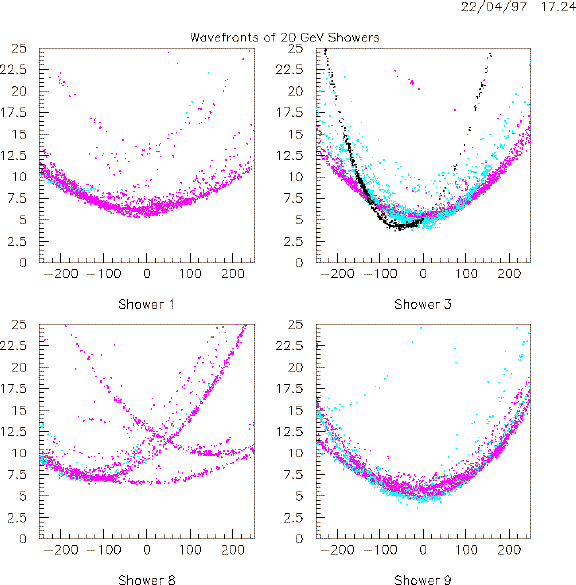 This series of plots shows the arrival times of the Cherenkov photons as a function of distance fromthe shower core for Monte-Carlo generated 20 GeV atmospheric cascades. These plots were chosen to showthe variation in timing wavefronts due to fluctuation in shower development. The color indicate the altitude ofemission of the photons as described in Figure 1. . Introductory Page | Abstract | Introduction | Analytical Analysis | Shower Morphology | Summary and Conclusions | Recomendations | Index of Figures