Questions & Answers
October 13, 2022 Damage Mechanics Challenge Online Forum
This video addresses questions related to the data format, coordinate system and other information on submitting simulation results for the challenge, and a timeline for publication (pdf file of slides). The deadline for submission through PURR is November 14th, 2022. The results from the challenge will be presented at the Annual Fall Meeting of the American Geophysical Union in the following sessions on Tuesday December 13, 2022:
NG22A Fractures, Fracturing, and Fluid Flow: Validation Data Sets, Field & Laboratory Observations, and Computational Challenges I Oral
NG24A Fractures, Fracturing, and Fluid Flow: Validation Data Sets, Field & Laboratory Observations, and Computational Challenges II Online Poster Discussion
NG25C Fractures, Fracturing, and Fluid Flow: Validation Data Sets, Field & Laboratory Observations, and Computational Challenges III Poster
Here is an example of a journal paper from a challenge led by Sandia. If you have additional questions related to submission of results or AGU, please contact either Joseph Morris (morris55@llnl.gov) or Laura Pyrak-Nolte (ljpn@purdue.edu)
January 15, 2022 Damage Mechanics Challenge Online Forum
Response to Questions from Participants (coming soon)
- What are the dimensions of samples used in the Brazilian and UCS tests?
- Is the displacement rate on slide 8 of the slide deck correct?
- Do you have DIC images from the calibration Brazilian tests?
- How do you read the DIC data files?
- What is the blue color in the thin section images?
- Do we have to have results for all of the Challenge Questions and the Bonus Science Question
What are the dimensions of samples used in the Brazilian and UCS tests?
Do you have DIC images from the calibration Brazilian tests?
On Jan 15, 2022, images from a Brazilian test were uploaded to the directory that is accessible by Globus. The directory is “ExtraBT_DIC_demon” and contains analyzed and raw DIC images
How do you read the DIC data files?
Please download this pdf file (ReadingDICDataSets.pdf) that contains 3 slides on how to read the DIC data files.
What is the orientation of the sample during the Brazilian test?
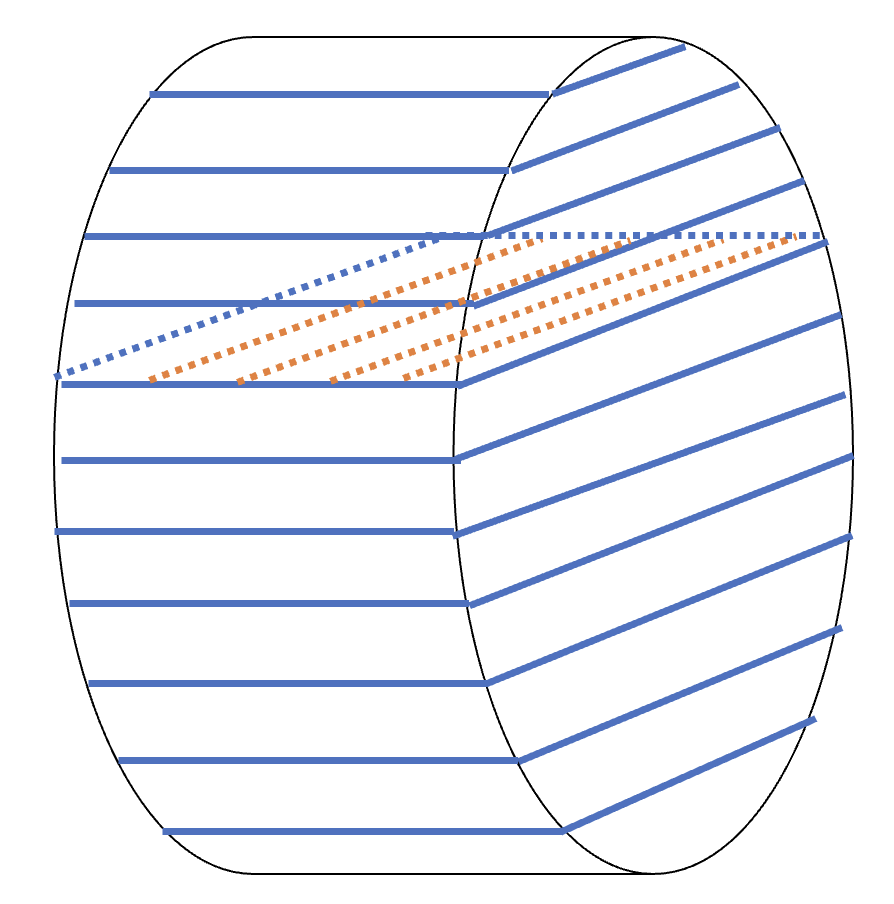
In the Figure, the blue lines represent the orientation of the layers. The red lines represent the direction of the application of the proprietary binder. The load was applied perpendicular to the layering.
We posted X-ray images of the notch geometry in the challenge samples prior to testing.
You can download the X-ray images of the challenge sample notch geometry through the Globus link. The files are in "XCT/before_test" directory.
What do the sample/data names mean?
3 Point Bending
UCS testing
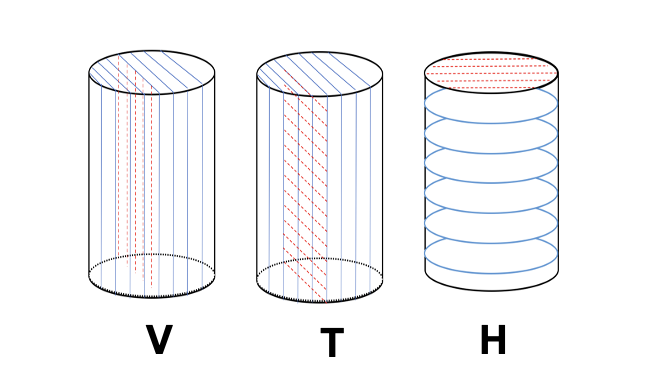
The blue lines represent the orientation of the layers. The red lines represent the direction of the application of the proprietary binder. The load was applied perpendicular to the top face of the cylinder.
How many samples were tested for the calibration data sets?
How many samples were tested for the challenge data set?
4 samples
Slide 11 with the calibration sample geometry was updated (Jan 19, 2022) to have the correct orientation.
The slide deck on PURR now has the correct notch orientation for the challenge geometry. This pdf file (Slide11.pdf) contains the same information.
How close do the simulation predictions need to be to the laboratory measured data?
The predictions will be compared with the envelope of the data. Predictions within the envelope will be scored as being consistent with the data. The distance from the data envelope will be used to measure discrepancy.
Can the timeline for the challenge be extended?
*We have modified the purpose of the ARMA Workshop for participants to:
- Provide overview of methods and historical usage to relevant materials
- Potentially participants show a comparison against the calibration data
- No simulations of challenge problems should be shown as this could corrupt the independence of the process.
*A session is planned in the Nonlinear Geophysics section at the Fall AGU 2022 to reveal the results of the code comparisons and to have participants present their findings
Can you explain the publication plan?
The organizers and participants in the challenge who are willing to include their simulation results will write a joint paper (multi-author) for a peer-review journal.
Why is there variability in the peak failure load in the calibration data sets?
Failure is affected by the notch geometry and local distribution of the minerals above the notch, as well as material variability. For more details on material variability see the link to Jiang et al. (2020) in the next answer.
Can you post your previous work on the 3D printed gypsum rock?
Here is a link to a paper
Don’t forget to include the supplemental information (MineralFabricSuppleMental.pdf) if you download the paper.
Additional information can also be found in the following Sandia Report
Yoon, H., Williams, M,., Chang, K. W., Bower, J. E., Pyrak-Nolte, L., Bobet, A., Integrated geomechanics and geophysics in induced seismicity: Mechanisms and monitoring. SAND-2019-11256, Sandia National Lab. (SNL-NM), Albuquerque, NM (United States). https://doi.org/10.2172/1763260 https://www.osti.gov/biblio/1763260
What is the blue color in the thin section images?
The blue color in the thin section shows a blue color epoxy that fills in the pore space, so it represents the pore space.
Do we have to have results for all of the Challenge Questions and the Bonus Science Question?
No. You can answer some or all of the questions.