Conductance histogram of 100 breaking curves: By Laetitia Soukiassian
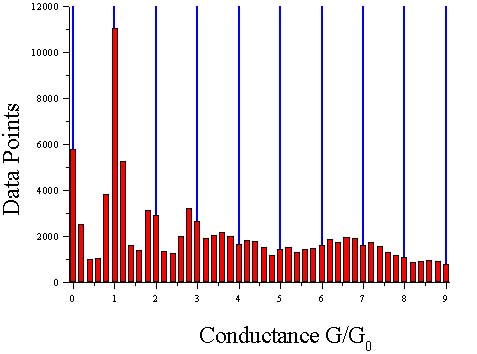
This histogram was acquired with a digital oscilloscope interfaced with a computer. It is a cumulative histogram of 100 current vs time curves taken
as the junction breaks. It exhibits 3 peaks near 1, 2 and 3 G0 which are evidence that support the quantization of the conductance in Au break
junctions.

Laetitia Soukiassian
Ron Reifenberger
Last modified: Fri Jul 19 11:06:22 EST 2002