 |
|
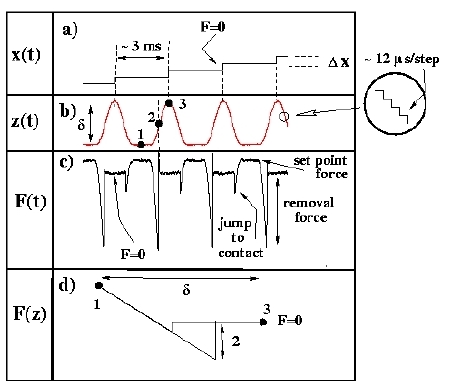
| x(t) | The sample is moved a small distance and held in place for 3 ms. |
| z(t) | While the sample is stationary, the tube is periodically pulled away from the sample and pushed back in about ten times per data point. |
| F(t) | The normal force (on the cantilever) is measured by the photodiode - it is this data which is used to make plots like the ones below. |
| F(z) | Additionally, Force vs. distance can be plotted for desired points. |