 |
Prof. Francis RobicheauxI've been a
professor of physics at Purdue University since 2013 (previously at
Auburn University 1993-2013). My research area is Theoretical Atomic
Physics, focusing on coherence and decoherence in quantum
systems, many body processes when photons interact with many atoms,
highly
excited (Rydberg) atoms, strong fields, and
ultracold plasmas. My group typically consists of undergrads,
grad students, and postdocs. I'm a member of the ALPHA collaboration:
the first group to trap the antimatter version of the Hydrogen atom and
the only group to quantitatively measure its properties.
|
|
|
Antimatterwikipedia article on antimatter We are part of the ALPHA collaboration which includes groups from over 10 countries. The experiment is performed at CERN. The eventual goal is to perform spectroscopy on antihydrogen and compare the frequencies with those in hydrogen. Currently, the 1S-2S frequency is known to 15 significant digits in hydrogen. Our measurements in antihydrogen have achieved 12 significant digits of accuracy with very few atoms (of order 1000). We have also measured the hyperfine splitting of the 1S and 2S states and the net charge of antihydrogen. There would be profound implications for our understanding of fundamental physical laws if there were to be any difference between the spectra of antihydrogen and hydrogen. Below is a brief description of results in four important publications. G. B. Andresen, et al (ALPHA collaboration), "Trapped antihydrogen," Nature 468, 673 (2010). PDF (946 kB) (Many online articles) This was the first report of trapped antihydrogen and gives an idea of what is needed to make and trap antihydrogen.   M. Ahmadi, et al (ALPHA collaboration), "Characterization of the 1S-2S transition in antihydrogen," Nature 557, 71 (2018). PDF (1850 kB) (CERN comment, CERN Courier about previous work cover and pgs 30-34) This was the second report on the 1S-2S transition but the first that mapped out the transition line. This was one of the biggest of the original goals of the ALPHA experiment. This line was measured with an accuracy of a few Hz in hydrogen. This first measurement achieved an accuracy of a few kHz even though we have several orders of magnitude fewer atoms and our experiments are in strong magnetic fields. 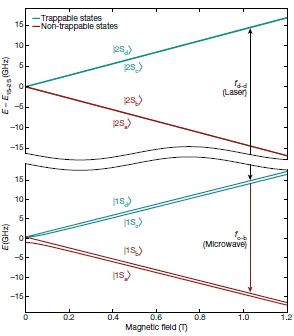 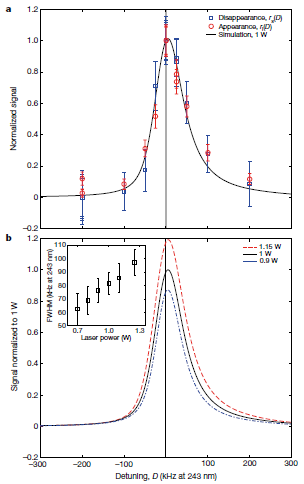 M. Ahmadi, et al (ALPHA collaboration), "Observation of the 1S-2P Lyman-alpha transition in antihydrogen," Nature 561, 211 (2018). PDF (1770 kB) This was the first report of the Lyman-alpha transition in antihydrogen. This measurement is important because it strongly suggests a method for laser cooling antihydrogen. 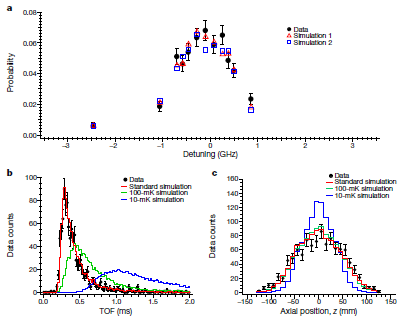 C.J. Baker, et al (ALPHA collaboration), “Laser cooling of antihydrogen atoms,” Nature 592, 35 (2021). PDF (3650 kB) CERN press release, Purdue press release, various news reports This reports the successful exprimental realization of laser cooling of antihydrogen verifying our prediction in 2013 that the restricted geometry would not too adversely affect the cooling. This is an important milestone because it will lead to more accurate determination of the transition frequency and higher signal strength. 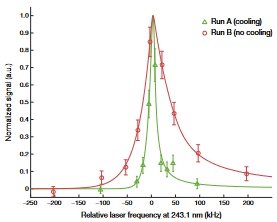 Five
Other Recent Publications
C.J. Baker, et al (ALPHA collaboration), “Sympathetic cooling of positrons to cryogenic temperatures for antihydrogen production,” Nat. Commun. 12, 6139 (2021). PDF (1680 kB) M. Ahmadi, et al (ALPHA collaboration), "Investigation of the fine structure of antihydrogen," Nature 578, 375 (2020). PDF (1890 kB) M. Ahmadi, et al (ALPHA collaboration), "Antihydrogen accumulation for fundamental symmetry tests," Nature Comm. 8, 681 (2017). PDF (703 kB) M. Ahmadi, et al (ALPHA collaboration), "Observation of the hyperfine spectrum of antihydrogen," Nature 548, 66 (2017). PDF (762 kB) M. Ahmadi, et al (ALPHA collaboration), "An improved limit on the charge of antihydrogen from stochastic acceleration," Nature 529, 373 (2016). PDF (641 kB) |
robichf[at]purdue.edu Links: |