

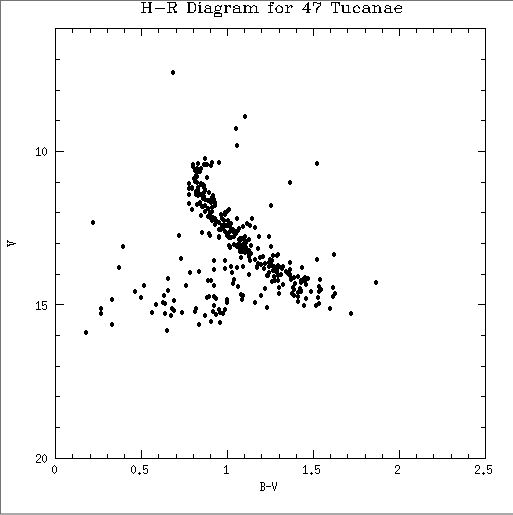
The vertical axis is the V magnitude of the star we measure here on Earth. Lower numbers imply a brighter star in the V band, so stars with a negative magnitude are brighter than stars with positive magnitude.
The horizontal axis is a measure of the temperature T = 7090/[ (B-V) + 0.71 ] assuming radiation from a blackbody. The graph is historically presented with hotter stars on the left.
The locus of stable points for hydrogen burning stars is called the 'Zero Age Main Sequence' (ZAMS) which is where all young stars reside. Once a star consumes its hydrogen, it will evolve away from the ZAMS due to the changing stellar thermodynamics and nuclear processes. We say that the star 'turns off' of the main sequence. Based upon stellar composition and mass, the turn-off point, and therefore the age, of a cluster can be determined.
Aperture photometry involves summing the flux from a star inside a certain radius, generally 4.5 * FWHM of the star. This flux is proportional to the number of counts in a CCD pixel. The sky background is taken from an annulus concentric with the program star and extending 20 pixels in radius. The background is the mode of all pixels in this region, and is subtracted from the measured flux. This provides an instrumental magnitude which can be calibrated with offsets determined from the standard star observations.
A standard star is a star whose photometric characteristics are well known and constant. By observing a standard star at the same zenith angle (polar angle from ÔoverheadŐ) as the program field, you can compensate for atmospheric attenuation along the line of sight (airmass). The offsets determined this way are used to place the program stars on the magnitude scale.
In a crowded field, PSF fitting must performed. This involves determining a profile of the observed stars and subtracting off neighboring stars before the aperture photometry. In this way, only light from the program star contributes to the measured flux.
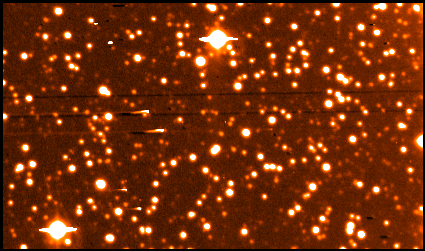 NOAO-supplied standard field of the outer edge
of 47 Tucanae. This V frame is a 15 second
exposure.
NOAO-supplied standard field of the outer edge
of 47 Tucanae. This V frame is a 15 second
exposure.
 This HR diagram clearly shows a turn-off for the
cluster. Since no standard stars were supplied,
the actual position of this turn-off can not be
determined, and only instrumental magnitudes
were plotted.
This HR diagram clearly shows a turn-off for the
cluster. Since no standard stars were supplied,
the actual position of this turn-off can not be
determined, and only instrumental magnitudes
were plotted.
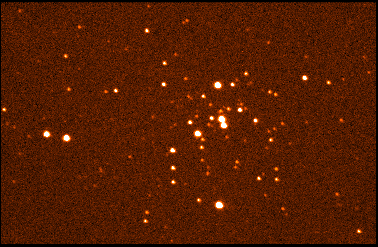
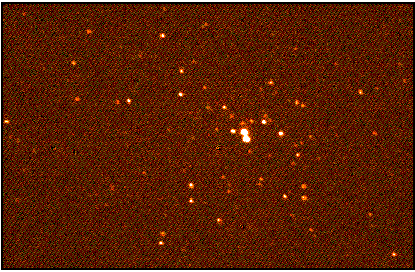
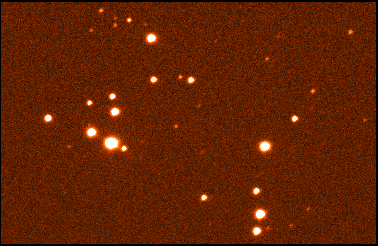 25 second V exposure of NGC 2169.
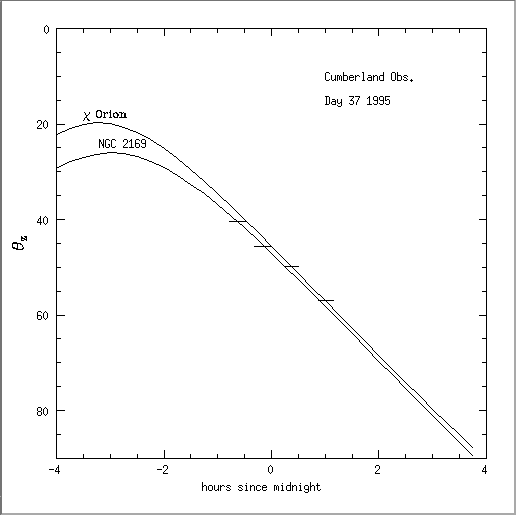 This zenith angle chart displays the first error
encountered in these observations. This chart
was made after the observations and shows that
the standard star, Chi Orion, was observed at a
different airmass than the standard. An optimum
observation would have occurred at the same
airmass, and also would have included both a red
and a blue standard to better gauge the
atmospheric attenuation.
This zenith angle chart displays the first error
encountered in these observations. This chart
was made after the observations and shows that
the standard star, Chi Orion, was observed at a
different airmass than the standard. An optimum
observation would have occurred at the same
airmass, and also would have included both a red
and a blue standard to better gauge the
atmospheric attenuation.
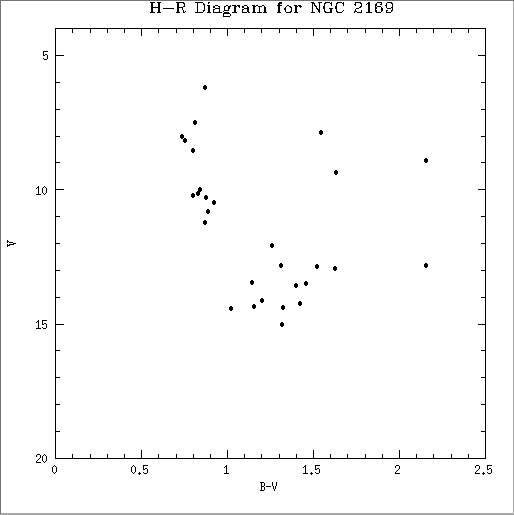 This HR diagram cannot be considered to be an
accurate description of the stellar composition
of NGC 2169 for the reasons outlined above.
This HR diagram cannot be considered to be an
accurate description of the stellar composition
of NGC 2169 for the reasons outlined above.
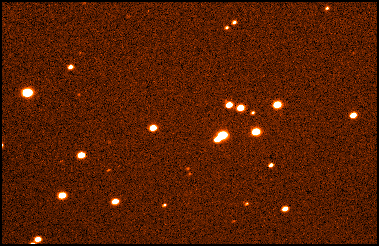
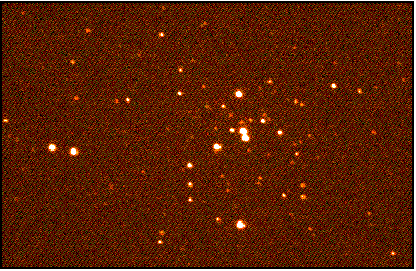
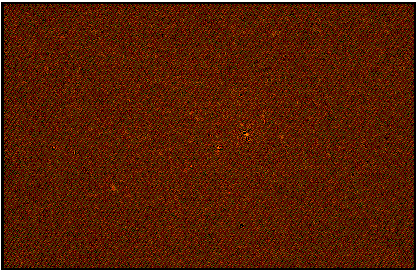
 30 second V exposure of NGC 637.
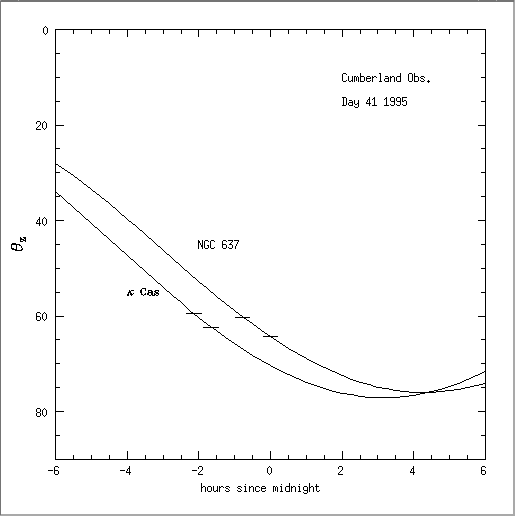 This zenith angle chart displays the second
error encountered in these observations. This
chart was also made after the run and shows that
the observations were made at such a low zenith
angle that the atmosphere attenuation was
considerable. In addition, the standard star,
even though acquired at approximately the same
zenith angle, is red in color and does not
provide sufficient correction for the B band.
An optimum observation would have occurred at a
smaller zenith angle, and also would have
included both a red and a blue standard to
better gauge the atmospheric attenuation.
This zenith angle chart displays the second
error encountered in these observations. This
chart was also made after the run and shows that
the observations were made at such a low zenith
angle that the atmosphere attenuation was
considerable. In addition, the standard star,
even though acquired at approximately the same
zenith angle, is red in color and does not
provide sufficient correction for the B band.
An optimum observation would have occurred at a
smaller zenith angle, and also would have
included both a red and a blue standard to
better gauge the atmospheric attenuation.
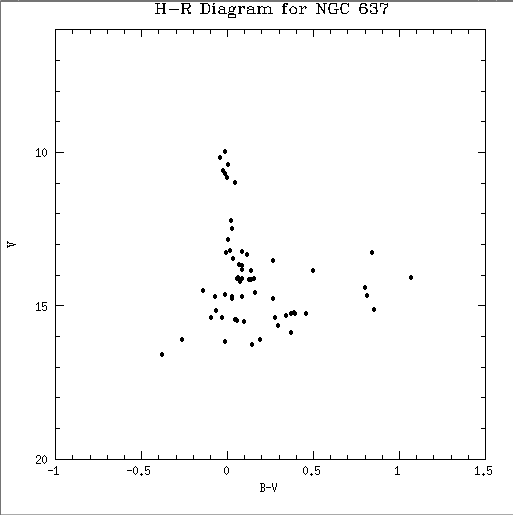 This HR diagram cannot be considered to be an
accurate description of the stellar composition
of NGC 637 for the reasons outlined above.
This HR diagram cannot be considered to be an
accurate description of the stellar composition
of NGC 637 for the reasons outlined above.
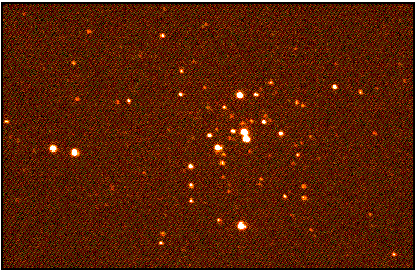
 60 second B exposure of NGC 2281.
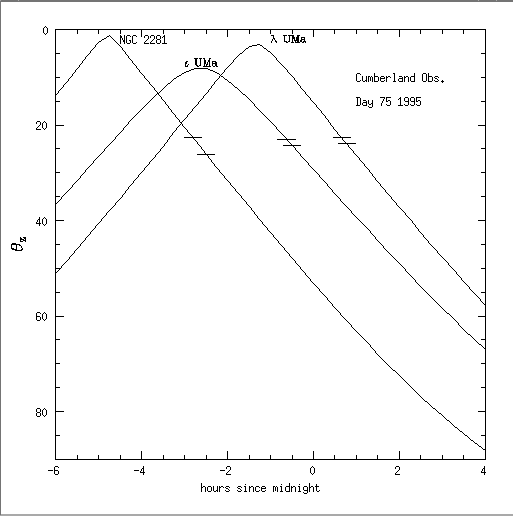 This zenith angle chart displays the correct
procedures for acquiring high-quality
observational data. All observations occurred
within the same range of zenith angles, and both
a red (Iota UMa) and blue (Lambda UMa) standard
were used to calibrate the magnitude scale.
This zenith angle chart displays the correct
procedures for acquiring high-quality
observational data. All observations occurred
within the same range of zenith angles, and both
a red (Iota UMa) and blue (Lambda UMa) standard
were used to calibrate the magnitude scale.
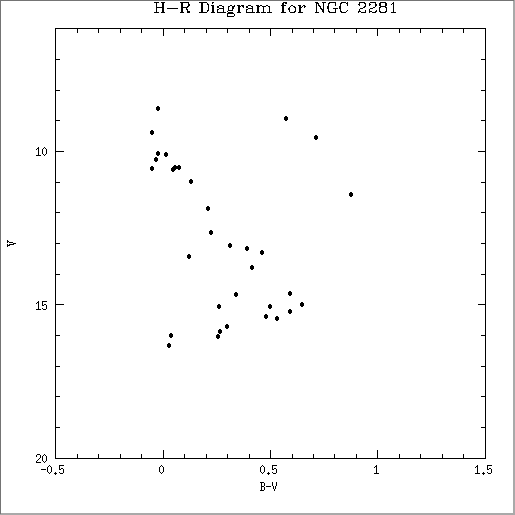 This HR diagram can be considered an accurate
description of the stellar composition of NGC
2281, and therefore can be inferred to lie upon
the ZAMS appropriate for this cluster.
This HR diagram can be considered an accurate
description of the stellar composition of NGC
2281, and therefore can be inferred to lie upon
the ZAMS appropriate for this cluster.
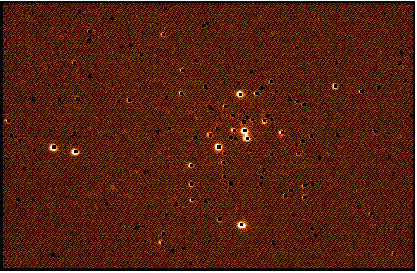
 This is the original V CCD image for NGC 637
 Here, all features in this frame with a Full
Width at Half Maximum (FWHM) of 3 pixels (appx.
4 arcsec) and heights greater than 3.5 sigma
above background are marked and their positions
recorded
Here, all features in this frame with a Full
Width at Half Maximum (FWHM) of 3 pixels (appx.
4 arcsec) and heights greater than 3.5 sigma
above background are marked and their positions
recorded
 Bright, isolated stars are then manually chosen
and their stellar profiles recorded up to a
predetermined radius (11 pixels). These
profiles are then integrated to fit a Point
Spread Function (PSF) which is characteristic of
the night's observations.
Bright stars are most useful to define a PSF, as
statistical fluctuations are much less
significant. These stars and their registered
neighbors are then subtracted to determine if
the PSF is accurate. As you can see, the stars
are cleanly subtracted, indicating a good PSF
fit.
Bright, isolated stars are then manually chosen
and their stellar profiles recorded up to a
predetermined radius (11 pixels). These
profiles are then integrated to fit a Point
Spread Function (PSF) which is characteristic of
the night's observations.
Bright stars are most useful to define a PSF, as
statistical fluctuations are much less
significant. These stars and their registered
neighbors are then subtracted to determine if
the PSF is accurate. As you can see, the stars
are cleanly subtracted, indicating a good PSF
fit.
 Now the PSF stars are left in the frame and only
their neighbors are subtracted. Compared to the
original frame, the bright stars remain but
their dimmer neighbors are gone. This leaves
totally isolated stars from which a second, more
accurate PSF is determined.
Now the PSF stars are left in the frame and only
their neighbors are subtracted. Compared to the
original frame, the bright stars remain but
their dimmer neighbors are gone. This leaves
totally isolated stars from which a second, more
accurate PSF is determined.
 This second PSF is then used in an iterative
method in which each star has its neighbors
subtracted and magnitude determined using
aperture photometry. The cleanliness of this
frame, which should be empty of all marked
stars, indicates the accuracy of both the PSF
and magnitude determination.
This second PSF is then used in an iterative
method in which each star has its neighbors
subtracted and magnitude determined using
aperture photometry. The cleanliness of this
frame, which should be empty of all marked
stars, indicates the accuracy of both the PSF
and magnitude determination.
John P. Finley - For undertaking this venture as my advisor and for direction in research procedures.
Jim Gaidos - For assistance in and exposure to research opportunities.
Chang-Yung Lee - Help in observing
Tom Moffett - For assistance in using IRAF
Anthony Roach - For assistance in observing, buying me McDonald's, and organizing this display.