These are plots derived from the Whipple 10m Cotton-Davies ray
tracingsimulation subroutine (W10M_FULL_ABERRATION) used in the KASCADE
simulation system of programs. It is used as part of the telescope
model in the simulation.The routine does a full ray tracing of the
Cotton-Davies mirror (made up of'facets') and includes a facet
Point-Spread-Function(PSF) to model the inherentspot size from a facet
(and average misalignments of the facets). This PSF ismodeled as a
gaussian with a width of .05 degrees. As can be seen in
theW10M_FWHM.GIF plot, this value of the width may be a little small
and could probably be increased to 0.075 to get the measured PSF width
of .11 deg for the 7.3 m focal length Whipple 10m mirror. I present
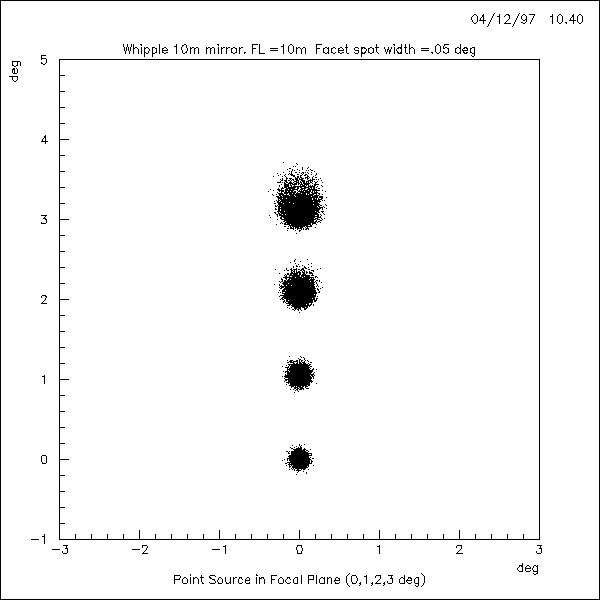
here 3 sets of plots. Each set was for a different focallength of the
the mirror: 7.3m is the present mirror. Also presented are plotsfor 10m
and 12m focal lengths. These other focal lengths are presented to
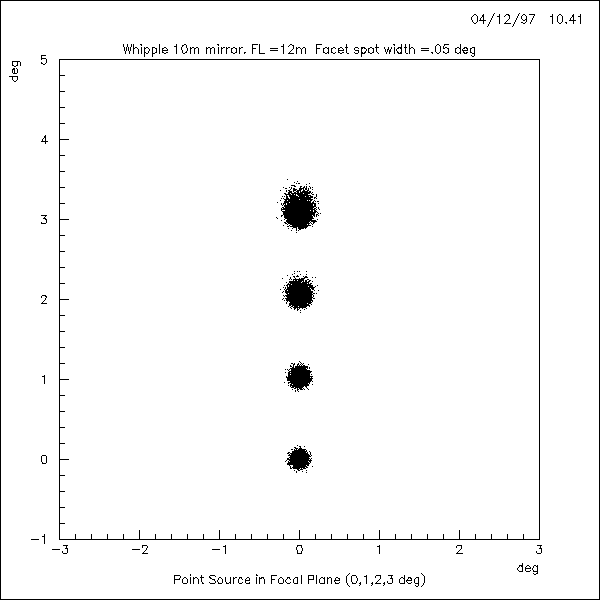
provide some background for VERITAS. Within a set of plots is a plot
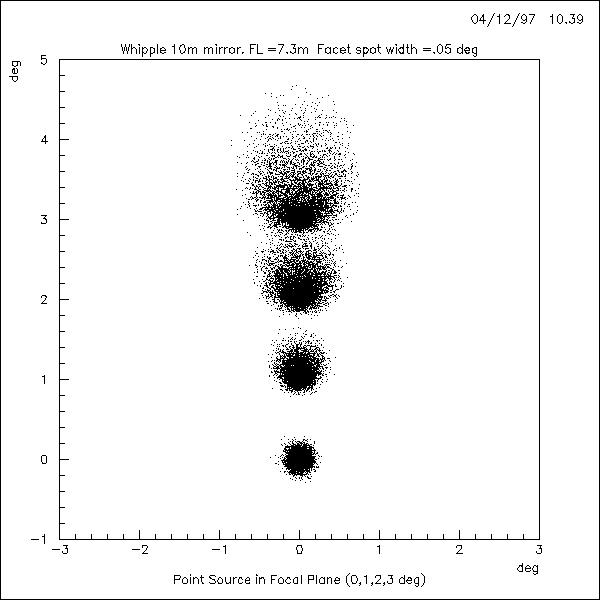
(SPOTS7_3.GIF etc.) of the appearance inthe focal plane of a point
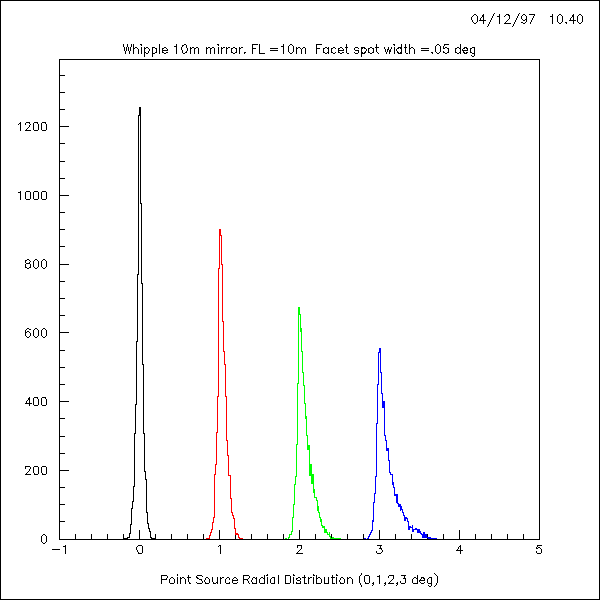
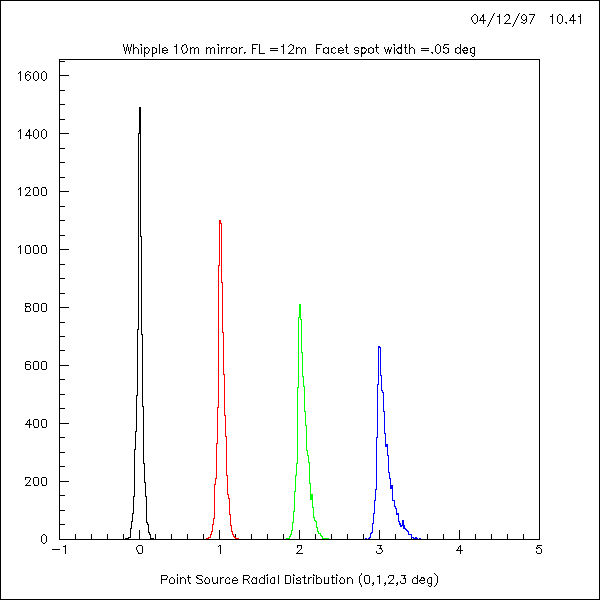
source at various angles (0,1,2,3 deg) off axis. Asecond plot
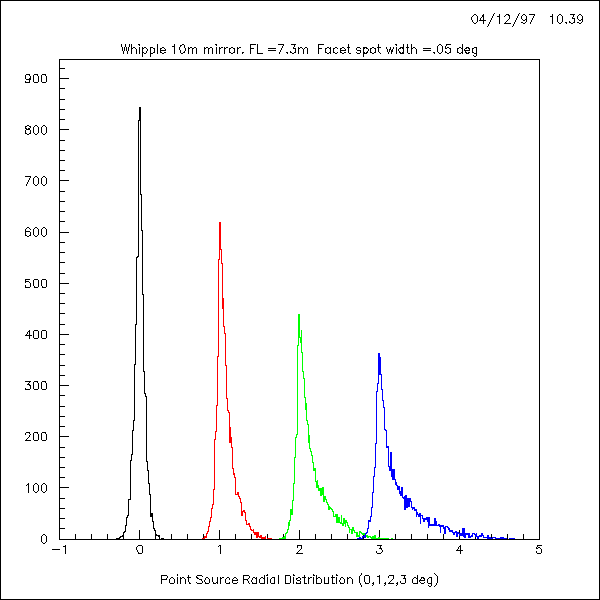
(WX7_3.GIF etc.) is the distribution of arrival positions radiallyfor
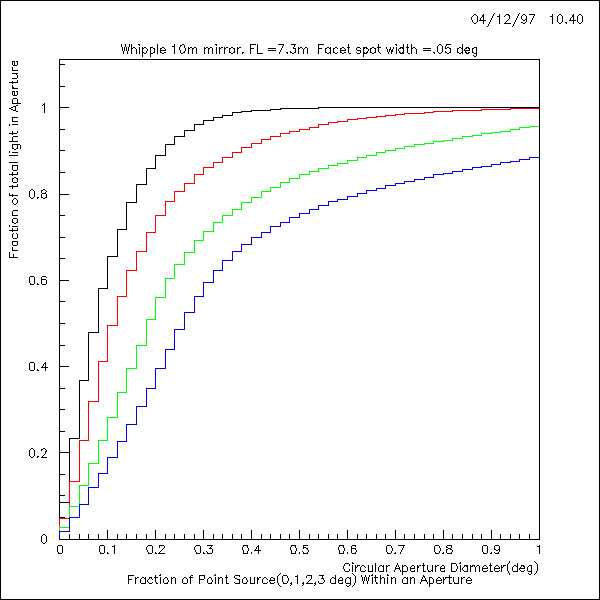
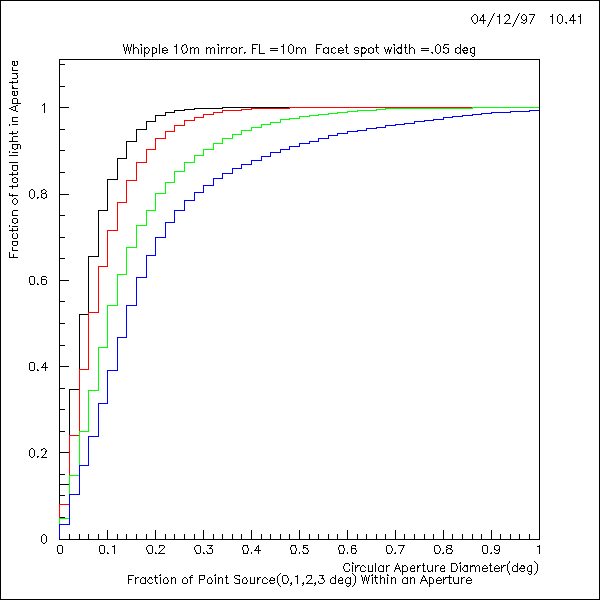
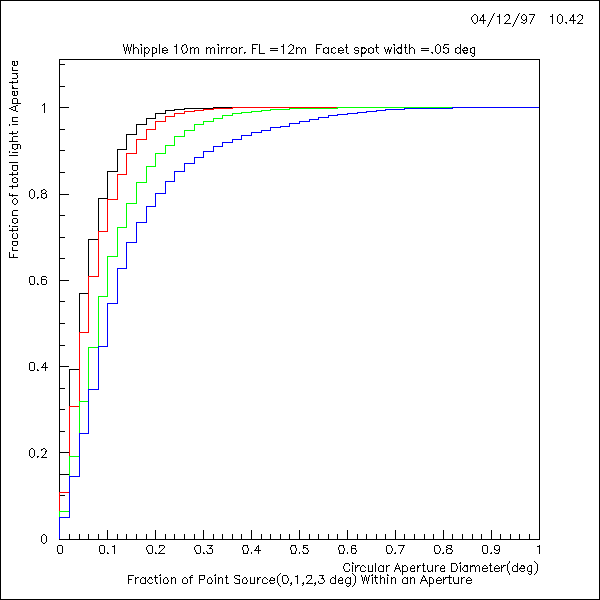
these spots. The last plot in the set (APERTURE7_3.GIF etc.) shows for
various circular aperture sizes centered on the mean position of a spot
the fraction of light that would go through the aperture. This last
plot is usefulin determining requirements for pixel sizes in the
camera. The plot W10M_FWHM.GIF shows the FWHM values for the spots for
the 3focal lengths. Note that because of the long tails at the large
off-axis anglesthis plot does not do an adequate job in characterizing
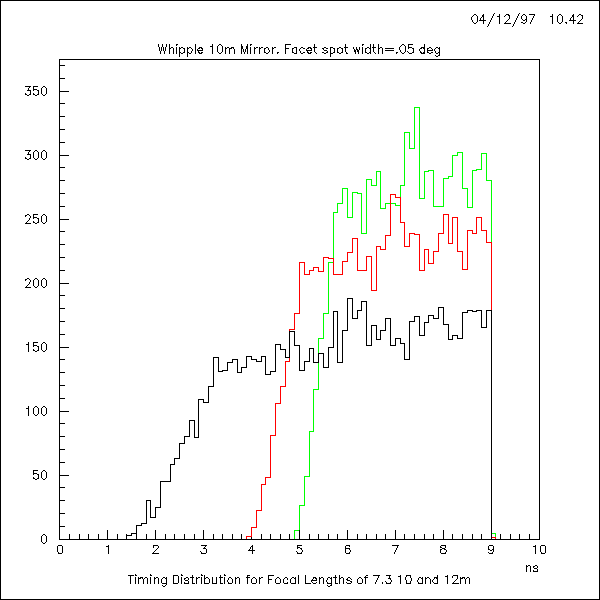
the aberrations. The final 2 plots are of the timing spread of the
photons due to thediffering path lengths photons travel when they
impact at various radialpositions on the mirror. The first plot
(W10M_TIMING.GIF) shows all three focallengths for an on-axis (0 deg)
point source. The square shape of the distribution is real and really
is 6 ns for the 7.3m focal length mirror. The shape and width are not
much different for the off-axis positions (notshown). The final plot
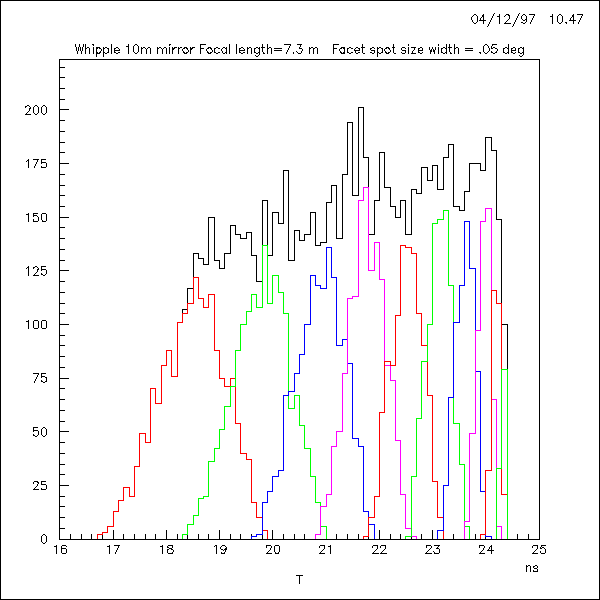
(W10M7_3_TIMING_RADIAL.GIF) is really only for those whoquestion the
validity of the square shape. It shows for various .5m steps in radial
position on the mirror the contributions to the timing
distribution.Glenn Sembroskisembroski@physics.purdue.edu765-494-5172
- SPOTS7_3, Image plane,
7.3m focal length mirror.
- WX7_3, Radial distribution,
7.3mfocal length mirror.
- APERTURE7_3, Fraction
of lightthough various apertures, 7.3m focal length mirror.
- SPOTS10, Image plane, 10m
focal length mirror.
- WX10, Radial distribution,
10mfocal length mirror.
- APERTURE10, Fraction of
light though various apertures, 10m focal length mirror.
- SPOTS12, Image plane, 12m
focal length mirror.
- WX12, Radial distribution,
12mfocal length mirror.
- APERTURE12, Fraction of
light though various apertures, 12m focal length mirror.
- W10M_TIMING, Timing
structures for various focal lengths.
- W10M7_3_TIMING_RADIAL,
Diagnostic plot for timing spread.
Last modified 24-Oct-2005
Back to the KASCADE page